Today, we are going to discuss about a collection of useful utilities called "netutils-linux" that can be used to simplify Linux network troubleshooting and performance tuning. This suite of Linux utils helps you to automate the linux performance tuning process out of the box. Netutils-linux consists of the following tools:
- network-top
- snmptop
- irqtop
- softirq-top
- link-rate
- softnet-stat-top
- rss-ladder
- autorps
- maximize-cpu-freq
- rx-buffers-increase
- server-info
Netutils-linux - Simplify Linux Network Troubleshooting And Performance Tuning
Install Netutils-linux
Netutils-linux is developed using Python programming language. So, it can be easily installed using pip.
On Arch Linux and its derivatives, run the following command to install pip:
sudo pacman -S python-pip
On Debian, Ubuntu, Linux Mint:
sudo apt-get install python-pip
On RHEL, Fedora, CentOS:
sudo yum install python-pip
Or,
sudo dnf install python-pip
On SUSE/openSUSE:
sudo zypper install python-pip
After installing PIP, run the following command to install netutils-linux:
sudo pip install netutils-linux
Sample output would be:
Collecting netutils-linux
 Downloading netutils-linux-2.3.1.tar.gz
Collecting pyyaml (from netutils-linux)
 Downloading PyYAML-3.12.tar.gz (253kB)
 100% |████████████████████████████████| 256kB 221kB/s
Collecting ipaddress (from netutils-linux)
 Downloading ipaddress-1.0.18-py2-none-any.whl
Collecting six (from netutils-linux)
 Downloading six-1.10.0-py2.py3-none-any.whl
Collecting colorama (from netutils-linux)
 Downloading colorama-0.3.9-py2.py3-none-any.whl
Collecting prettytable (from netutils-linux)
 Downloading prettytable-0.7.2.zip
Requirement already satisfied (use --upgrade to upgrade): argparse in /usr/lib/python2.7 (from netutils-linux)
Installing collected packages: pyyaml, ipaddress, six, colorama, prettytable, netutils-linux
 Running setup.py install for pyyaml ... done
 Running setup.py install for prettytable ... done
 Running setup.py install for netutils-linux ... done
Successfully installed colorama-0.3.9 ipaddress-1.0.18 netutils-linux-2.3.1 prettytable-0.7.2 pyyaml-3.12 six-1.10.0
Usage
Like I mentioned in the introductory section, Netutils-linux contains a bunch of utilities specially designed for network troubleshooting and performance tuning purposes. All utilities are categorized into three sections, namely:
- Monitoring
- Tuning
- Hardware and its configuration rating
1. Monitoring
All these top-like tools that falls under monitoring section don't require root or sudo privileges. You can use them as normal user.
network-top
This utility allows you to monitor interrupts, soft interrupts, network processing statistic for devices and CPUs. To run this utility, enter:
network-top
Here is the sample output from my Ubuntu 16.04 LTS server.

To exit this utility, press CTRL-C.
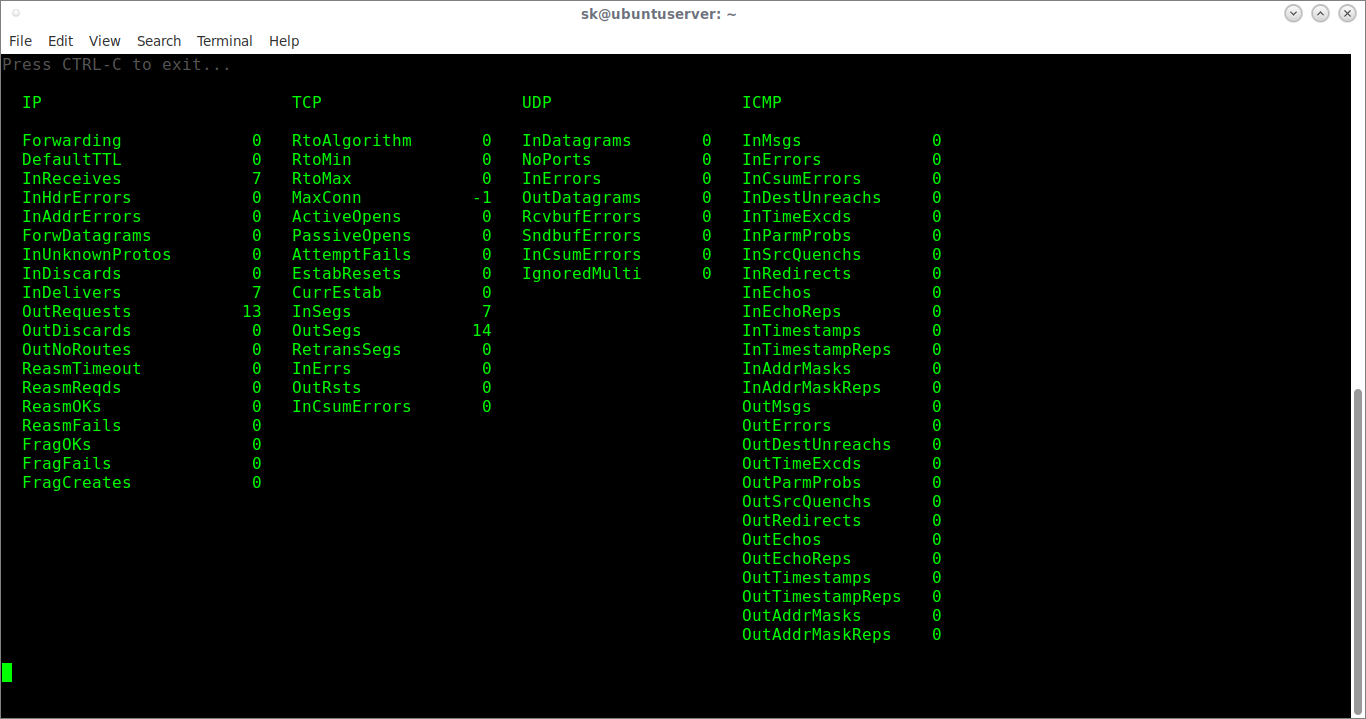
Snmptop
It is a basic /proc/net/smmp file watcher.
To run this utility, enter the following command:
snmptop
irqtop
This utility shows you a rate of interrupts based on /proc/interrupts file of your Linux system.
Run this utility using command:
irqtop

Softirq-top
It shows you a rate of receiving and transmitting packets based on /proc/softirqs file.

Link-rate
It shows how many packets/bytes a network interface receives/transmits and how many errors happened based on /sys/class/net/XXX/statistic/YYY files.

Softnet-stat-top
It shows various statistics of packets processing per CPU of your Linux box.

2. Tuning
You must either root or sudo user to run these tools.
rss-ladder
It automatically set smp_affinity_list for IRQ of NIC rx/tx queues that usually work on CPU0 out of the box.
rss-ladder enp0s3 0
Autorps
It enables RPS on all available CPUs of NUMA node local for the NIC for all NIC’s rx queues. It is good for cheap network interface cards.
Example:
$ sudo autorps enp0s3
 Using mask '1' for enp0s3-rx-0
maximize-cpu-freq
This utility sets every CPU scaling governor mode to performance and set max scaling value for min scaling value. So you can use all power of your processor. It is quite useful for latency sensible systems.
rx-buffers-increase
This utility finds and sets compromise-value between avoiding dropped/missing pkts and keeping a latency low.
Example:
$ sudo ethtool -g enp0s3
Ring parameters for enp0s3:
Pre-set maximums:
RX: 4096
RX Mini: 0
RX Jumbo: 0
TX: 4096
Current hardware settings:
RX: 256
RX Mini: 0
RX Jumbo: 0
TX: 256
$ sudo rx-buffers-increase enp0s3

run: ethtool -G enp0s3 rx 2048
$ sudo rx-buffers-increase enp0s3

enp0s3's rx ring buffer already has fine size.
$ sudo ethtool -g enp0s3
Ring parameters for enp0s3:
Pre-set maximums:
RX: 4096
RX Mini: 0
RX Jumbo: 0
TX: 4096
Current hardware settings:
RX: 2048
RX Mini: 0
RX Jumbo: 0
TX: 256
Hardware and its configuration rating
server-info
This utility is similar to lshw command.
$ sudo server-info show
cpu:
 info:
 Architecture: x86_64
 BogoMIPS: 4589
 Byte Order: Little Endian
 CPU MHz: 2294
 CPU family: 6
 CPU op-mode(s): 32-bit, 64-bit
 CPU(s): 1
 Core(s) per socket: 1
 Flags: fpu vme de pse tsc msr pae mce cx8 apic sep mtrr pge mca cmov pat pse36
 clflush mmx fxsr sse sse2 syscall nx rdtscp lm constant_tsc rep_good nopl xtopology
 nonstop_tsc pni pclmulqdq monitor ssse3 cx16 sse4_1 sse4_2 popcnt xsave avx
 hypervisor lahf_lm
 Hypervisor vendor: KVM
 L1d cache: 32K
 L1i cache: 32K
 L2 cache: 256K
 L3 cache: 3072K
 Model: 42
 Model name: Intel(R) Core(TM) i3-2350M CPU @ 2.30GHz
 NUMA node(s): 1
 NUMA node0 CPU(s): 0
 On-line CPU(s) list: 0
 Socket(s): 1
 Stepping: 7
 Thread(s) per core: 1
 Vendor ID: GenuineIntel
 Virtualization type: full
 layout:
 '0': '0'
disk:
 sda:
 model: 'VBOX HARDDISK '
 size: 21474836480
 type: HDD
 sr0:
 model: CD-ROM
memory:
 MemFree: 254244
 MemTotal: 1016264
 SwapFree: 1046028
 SwapTotal: 1048572
net:
 enp0s3:
 buffers:
 cur: 256
 max: 4096
 conf:
 ip: ''
 vlan: false
 driver:
 driver: e1000
 version: 7.3.21-k8-NAPI
 queues:
 own: []
 rx: []
 rxtx: []
 shared:
 - 19-fasteoi ehci_hcd:usb1, enp0s3
 tx: []
 unknown: []
Server-info utility can also rate the hardware and its features on the scale of 1-10.
$ sudo server-info rate
cpu:
 BogoMIPS: 2
 CPU MHz: 2
 CPU(s): 1
 Core(s) per socket: 1
 L3 cache: 2
 Socket(s): 1
 Thread(s) per core: 10
 Vendor ID: 10
disk:
 sda:
 size: 1
 type: 1
 sr0:
 size: 1
 type: 2
memory:
 MemTotal: 1
 SwapTotal: 2
net:
 enp0s3:
 buffers:
 cur: 1
 max: 10
 driver: 3
 queues: 1
system:
 Hypervisor vendor: 1
 Virtualization type: 1
And, that's all for now folks. More good stuffs to come. Stay tuned!
Cheers!!
Resource:
Thanks for stopping by!
Help us to help you:
- Subscribe to our Email Newsletter : Sign Up Now
- Support OSTechNix : Donate Via PayPal
- Download free E-Books and Videos : OSTechNix on TradePub
- Connect with us: Facebook | Twitter | Google Plus | LinkedIn | RSS feeds
Have a Good day!!