
Your website loads in 300 milliseconds on your local system. You deploy a content delivery network (CDN), a system of servers spread across many locations that store copies of your content closer to your users. Everything looks fast. You call it done.
Then a user on another continent reports slow load times. Your monitoring dashboard shows no problem. This is confusing, but it has a simple explanation. A test from one machine only tells you how your site performs from one location. It cannot tell you how your site performs everywhere else.
This guide shows you how to test CDN performance from the command line on Linux. You will learn how to measure connection speed, check whether the CDN is serving cached content, and test performance from multiple regions. Every tool here runs on a standard Linux system.
By the end, you will be able to answer these questions:
- How fast does DNS resolve your domain?
- How long does the connection take to establish?
- How long does the TLS handshake take?
- How quickly does the first byte of content arrive?
- Is the CDN actually serving the request from cache?
- Does performance vary by region?
Table of Contents
Why the Command Line Works Well for This
Browser-based tools show you total load time. They mix together network delays, JavaScript execution, and rendering time. This makes it hard to isolate where time is actually spent.
The curl command line tool solves this problem. It measures each stage of a request separately. It also skips browser rendering entirely, so the numbers reflect only the network and server response.
Here is a basic command that measures a single request:
curl -sS -o /dev/null -w \
'DNS: %{time_namelookup}s
Connect: %{time_connect}s
TLS: %{time_appconnect}s
TTFB: %{time_starttransfer}s
Total: %{time_total}s
IP: %{remote_ip}
' \
https://example.com/
This command uses curl to measure and display detailed timing metrics for an HTTPS connection to example.com, without downloading the actual webpage content.
Expected Output:
DNS: 0.049033s
Connect: 0.078883s
TLS: 0.114448s
TTFB: 0.150471s
Total: 0.150763s
IP: 104.20.23.154
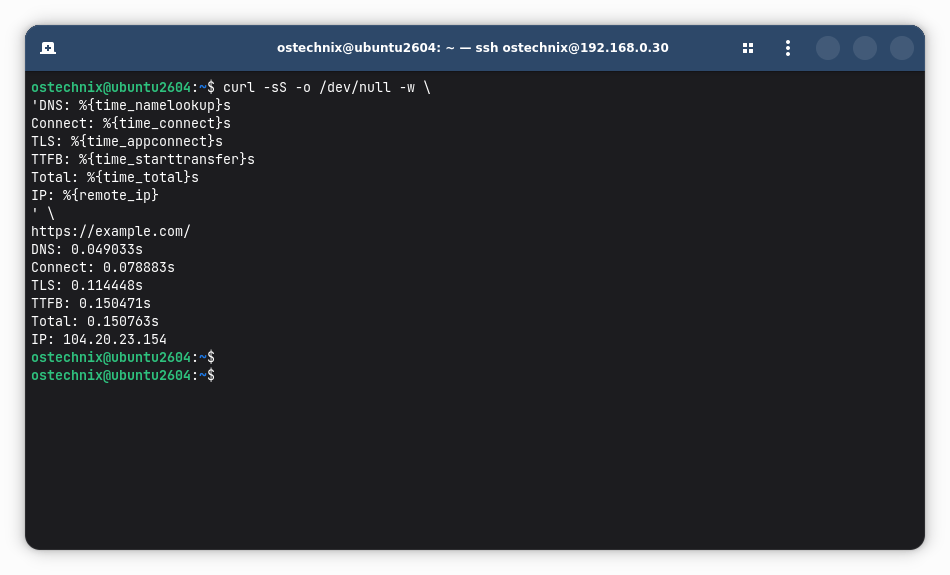
This command discards the response body (-o /dev/null) and prints only the timing data. Run it against your own site to get your first real measurement.
Breakdown of each part:
| Option | What it does |
|---|---|
-sS | Silent mode but shows errors if they occur |
-o /dev/null | Discards the downloaded response body (we only want timing data) |
-w | Writes custom output after the transfer completes using the specified format string |
The metrics displayed:
- DNS (
time_namelookup) - Time to resolve the domain name to an IP - Connect (
time_connect) - Time to establish the TCP connection - TLS (
time_appconnect) - Time for the TLS/SSL handshake - TTFB (
time_starttransfer) - Time to first byte (server response starts arriving) - Total (
time_total) - Full request/response time - IP (
remote_ip) - The IP address the connection used
It's useful for:
- Performance monitoring - Checking how fast a server responds
- Debugging - Identifying which part of the connection is slow (DNS, network, TLS, or server processing)
- Health checks - Verifying a server is reachable and responsive without downloading large content
Turning One Request into a Performance Profile
A single number like "1.2 seconds" does not tell you much. A request actually happens in stages. Each stage can be measured on its own.
Here is the sequence:
DNS lookup
    ↓
TCP connection
    ↓
TLS handshake
    ↓
Request sent
    ↓
First byte received
    ↓
Transfer completed
Each curl timing variable corresponds to one of these stages:
time_namelookup: time to resolve the domain name to an IP addresstime_connect: time to open a TCP connection to that IP addresstime_appconnect: time to complete the TLS handshake, the process that establishes an encrypted connectiontime_starttransfer: time until the first byte of the response arrives, also known as time to first byte (TTFB)time_total: time for the entire request to finish
This breakdown lets you find the actual source of slowness instead of guessing:
- A high DNS time points to a DNS problem.
- A high connection time points to a network or routing problem.
- A high TTFB with a normal connection time points to a slow server or CDN response.
- A large gap between TTFB and total time points to a large response or slow transfer.
Is the CDN Actually Serving the Request?
A fast response does not always mean the CDN is doing its job. The CDN might be forwarding every request to your origin server instead of serving from its cache. You can check this with response headers.
Run this command to see the headers without downloading the body:
curl -s -o /dev/null -D - https://example.com/ | grep -iE '(cache|age|served-by)'
Sample Output:
age: 6687
cf-cache-status: HIT
This sends a normal GET request and discards the body, printing only the headers. Avoid curl -I for this check. That flag sends a HEAD request instead of a GET request, and some CDNs treat HEAD requests differently from GET requests, since real users almost always send GET. Testing with HEAD can show you a cache status that does not match what your users actually see.
Look for a cache status header. The header name depends on your CDN:
- Cloudflare uses
CF-Cache-Status, with values such asHIT,MISS,EXPIRED,REVALIDATED,BYPASS, orDYNAMIC. - Fastly uses
X-Cache, with valuesHITorMISS, plusX-Cache-Hitsshowing how many times that object has been served from cache. Fastly also setsX-Served-Byto name the specific cache node, though this header alone does not indicate a hit or a miss. - Amazon CloudFront uses
X-Cache, formatted asHit from cloudfrontorMiss from cloudfront. - Akamai and legacy Azure CDN use
X-Cachevalues such asTCP_HITandTCP_MISS, but they expose this diagnostic information differently. Azure CDN (classic) generally returnedX-Cacheon ordinary responses. Akamai'sX-Cacheis primarily a diagnostic header and is normally requested explicitly, historically via a Pragma header such asPragma: akamai-x-cache-on(optionally combined withakamai-x-get-cache-key). Therefore, the absence ofX-Cachefrom an ordinary Akamai response should not be interpreted as a cache miss. Akamai now recommends its authenticated Enhanced Debug mechanism for this purpose.
An Age header, when present, shows how many seconds the content has been stored in cache.
A fast response with a MISS status means the CDN passed the request through. A fast response with a HIT status means the CDN is actually doing its job. These are two different things, and only one of them proves the CDN is working as intended.
One caution when testing this way:
curl does not send the same headers a browser sends by default, such as Accept-Encoding for compression.
Some CDNs, including CloudFront, include a normalized version of Accept-Encoding in the cache key when compression is enabled. Without that header, curl gets treated as requesting uncompressed content, which is stored as a separate cached copy from the compressed version browsers receive. This can produce a miss on your first curl request even when browsers are consistently getting a hit, since your request and a browser's request are matching different cached copies.
If your curl test shows a miss but real users see fast load times, this mismatch is worth checking before assuming there is a real caching problem.
A note on Azure: Microsoft is retiring Azure CDN Standard from Microsoft (classic) in favor of Azure Front Door. As of August 15, 2025, Azure CDN from Microsoft (classic) no longer supports new profile creation or domain onboarding, and it is scheduled for full retirement on September 30, 2027. Existing deployments can continue operating until retirement, so the
X-Cachebehavior described above remains relevant when testing a classic CDN endpoint. For new deployments, use Azure Front Door Standard or Premium instead; Front Door also exposesX-Cache, including values such asTCP_HIT,TCP_REMOTE_HIT, andTCP_MISS, but has additional/current diagnostic headers and conventions.
One Measurement Is Not Enough
A single request can be misleading. The first request to a URL might hit an empty cache, while later requests hit a warm one. Network conditions also change from moment to moment.
Run the same request multiple times in a loop:
for i in {1..10}; do
    curl -sS -o /dev/null -w \
    '%{http_code} %{time_starttransfer}s %{time_total}s\n' \
    https://example.com/
done
Sample Output:
200 0.146150s 0.146868s
200 0.231786s 0.232220s
200 0.077217s 0.077753s
200 0.240986s 0.241477s
200 0.682164s 0.682240s
200 0.132748s 0.133461s
200 0.410818s 0.933873s
200 0.087598s 0.088383s
200 0.256964s 0.745285s
200 0.679765s 0.882171s
Look at the pattern across the ten results, not just one line. A cold cache often shows a slower first request followed by faster ones.
Consistent numbers suggest a stable cache. Wide swings suggest a problem worth investigating further. The median value is usually more useful than the average, since a single slow outlier can skew an average without reflecting typical performance.
Understanding What the CDN Cache Is Actually Doing
A CDN's main job is caching, not just physical proximity to the user. Understanding a few terms makes the rest of this guide easier to follow.
- Cache hit: the CDN found a valid, stored copy of the content and served it directly.
- Cache miss: the CDN did not find a valid copy and had to fetch it from the origin server.
- TTL (time to live): how long the CDN keeps a cached copy before treating it as expired.
- Cache key: the set of values the CDN uses to decide whether two requests should return the same cached content.
- Origin request: a request the CDN sends to your actual server, made only on a cache miss.
- Edge location: a CDN server placed close to users, where cached content is stored and served.
The cache key matters more than most people expect. If your CDN includes unnecessary items in the cache key, such as extra request headers, cookies, or query string parameters, it creates more cache variants.
More variants mean more cache misses, since fewer requests match an existing cached copy. Keeping the cache key simple usually improves your hit ratio, the percentage of requests served from cache instead of the origin.
A Linux-Specific Detour: IPv4 vs IPv6
Most systems today support both IPv4 and IPv6. Performance can differ between the two, depending on your network path and your CDN's routing.
Test each version separately:
curl -4 -sS -o /dev/null -w '%{time_total}\n' https://example.com/curl -6 -sS -o /dev/null -w '%{time_total}\n' https://example.com/If one is noticeably slower, the difference may point to a routing issue specific to one protocol. This is worth checking, since some networks handle IPv6 less efficiently than IPv4, or the reverse.
Checking HTTP/3 Performance
Most major CDNs now support HTTP/3, a protocol version that runs over QUIC instead of TCP. QUIC is a transport protocol built on UDP. It removes a problem called head-of-line blocking, where a single lost packet delays every stream on a connection. This can make HTTP/3 noticeably faster on networks with packet loss, such as mobile connections.
Your curl build needs QUIC support to test this, which is not included in most default Linux package installations. Check whether your build supports it:
curl --version | grep -i http3
If HTTP/3 support is missing, you can still confirm that a server offers it by checking the Alt-Svc response header:
curl -s -o /dev/null -D - https://example.com/ | grep -i alt-svc
If your curl build does support HTTP/3, compare it directly against HTTP/2:
FORMAT='Protocol: %{http_version}  Total: %{time_total}s\n'
curl -s -o /dev/null --http2 -w "$FORMAT" https://example.com/
curl -s -o /dev/null --http3 -w "$FORMAT" https://example.com/
Check the %{http_version} value in the output to confirm which protocol was actually used.
When you request --http3, curl attempts a QUIC connection first, then falls back to HTTP/2 automatically if QUIC fails or is too slow. This fallback happens silently, so the request still succeeds even when HTTP/3 does not work. The version field in the output is the only reliable way to know which protocol was used.
DNS Is Part of the Path, Not Just a Lookup
DNS resolution is not a separate step from CDN performance. It is part of the path. Many CDNs use DNS to direct users to a nearby edge location, so the IP address you get back from a DNS query can vary based on where you are.
Check the current resolution with dig:
dig example.com
For a shorter output showing only the resolved IP address:
dig +short example.com
Keep three things separate in your mind: the DNS resolution step, the IP address it returns, and the actual CDN edge location that ends up handling your HTTP request.
A dig command tells you the first two. It does not confirm which physical facility served your request. Response headers, covered earlier, are a better source for that.
The Realization: One Machine, One Vantage Point
Every test so far has come from one machine, in one location. This is the central limitation of everything covered up to this point. Your measurements are accurate, but they only describe performance from where you happen to be standing.
This matters because CDNs route users to different edge locations depending on where the request originates. A CDN that performs well for you might route a user in another region to a slower or misconfigured edge location, and you would never see it from your own machine.
The next step is to run the same tests from multiple regions and compare the results. You are not looking for the single fastest number. You are looking for patterns:
- Is one region consistently slower than the others?
- Does TTFB vary a lot between regions?
- Do different regions get different cache statuses for the same content?
- Are some regions reaching a different edge location than expected?
- Does IPv4 or IPv6 performance differ by region?
Getting Requests From Multiple Regions
To test from multiple regions, you need requests that actually originate from those regions. There are a few practical ways to do this.
The first is infrastructure you already control in other regions, such as existing servers or branch offices. This gives you full control over the test environment, but it only works if you already have something running in the regions you care about.
The second is spinning up short-lived cloud virtual machines in target regions, using a provider such as DigitalOcean or Hetzner. This works well for occasional or one-time tests, though it takes time to set up and tear down each time you want to run a check.
A third option, useful for teams that do not want to provision and maintain test servers in every region, is routing test traffic through geographically distributed proxy endpoints. In some testing setups, dedicated rotating proxies can provide a controlled pool of regional endpoints for repeated checks, without the overhead of managing separate infrastructure in each location.
Each option involves a trade-off between control, setup effort, and how often you plan to run the tests. Pick the one that matches how frequently you need to check performance and how many regions you need to cover.
Building a Repeatable Test
Once you can send requests from multiple regions, combine everything covered so far into one script. For each request, record:
- timestamp
- region
- HTTP status code
- remote IP address
- DNS time
- connection time
- TLS time
- TTFB
- total time
A simple output format might look like this:
timestamp,region,status,remote_ip,dns,connect,tls,ttfb,total
2026-09-05T09:00:00Z,eu-west,200,104.16.1.1,0.012,0.034,0.089,0.145,0.210
2026-09-05T09:00:00Z,ap-southeast,200,104.16.2.5,0.028,0.061,0.140,0.310,0.402
You can pipe this output into a CSV file, a lightweight database such as SQLite, or a monitoring system such as Prometheus. Running the script on a schedule with cron turns a one-time check into an ongoing record of performance over time.
Interpreting the Results
Once you have data across multiple requests and regions, use these patterns to guide your investigation:
- High DNS time: check your DNS configuration and resolver performance.
- High connection time, normal DNS time: check network distance and routing to that region.
- High TTFB, normal connection time: check CDN or origin server processing, and cache status.
- Low TTFB, high total time: check response size and transfer speed.
- One region consistently slower than others: check routing, DNS steering, and CDN coverage in that region.
- High variability between repeated requests: trust the pattern across many requests, not a single result.
This turns raw numbers into a starting point for real troubleshooting.
What curl Will Not Tell You
Command-line testing has a limit worth stating clearly. curl measures network and HTTP-level performance. It does not run JavaScript, render pages, load images in the order a browser would, or measure layout shifts.
This means CLI testing is not a full substitute for browser-based performance testing. It is a complement to it. Use curl to isolate network and server-level issues. Use browser-based tools, such as your browser's developer tools or a synthetic monitoring service, to measure the full user experience, including rendering and client-side behavior.
Quick Reference
| Tool | What It Measures | Example Command |
|---|---|---|
curl -w | Request timing breakdown | curl -o /dev/null -w '%{time_total}\n' URL |
curl -D - | Response headers, cache status | curl -s -o /dev/null -D - URL \| grep -iE '(cache\|age)' |
curl --http3 | HTTP/3 (QUIC) vs HTTP/2 comparison | curl -o /dev/null -w '%{http_version}\n' --http3 URL |
dig | DNS resolution | dig example.com |
curl -4 / curl -6 | IPv4 vs IPv6 performance | curl -4 -o /dev/null -w '%{time_total}\n' URL |
Conclusion: Measure What Users Actually Experience
A CDN is not successful simply because it is turned on. The real question is whether it delivers your content quickly and consistently to users in the places where they actually live.
The workflow in this guide follows a simple pattern: measure, inspect, repeat, compare, diagnose, and measure again. Start with a single request on your own machine. Check whether the CDN is actually caching. Repeat the test to rule out noise.
Then extend the same method to multiple regions, using your own infrastructure, cloud test machines, or distributed proxy endpoints, depending on how often you need to check and how many regions you need to cover.
Command-line tools give you this entire workflow without paid monitoring software. The only requirement is building the habit of checking.
